
- Home
- Deceptions
- Solar
- Thermal Audit
- Ventilation
- Sensors
- Governance
- Environment
- Reference
- Contact
- News
Solar Hot Water - Economic Viability on the Canadian East Coast (Newfoundland, Nova Scotia, Prince Edward Island)
Note: this page is currently being updated daily with the latest data, diagrams and analysis ... (last update August 9, 2010)
I have never seen a solar panel (flat, evacuated tube or photovoltaic) on a residential roof or backyard in Eastern Canada. They exist, but are uncommon, and people passing by have to ask if the evacuated tube collector is for generating electricity or if is a contraption for something else. This is a state of affairs that will change once more people see them in action and are understand the economics. The most common economic guess is "not likely with all our rain drizzle and fog but ok down south".
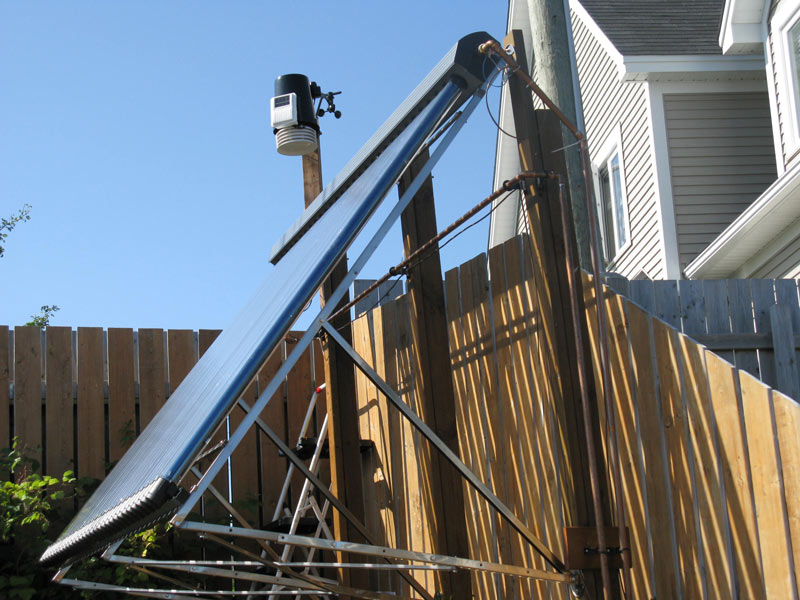
To evaluate the underlying economics, we set up a 30 tube EOS brand panel controlled by a RESOL Deltasol BS Plus. We also tried a Taco Solar X-block but abandoned it and moved our installation notes here. A Davis Vantage Pro2 weather station was installe to measure solar radiation, wind and temperature. The collector uses double wall glass sleeves with a vacuum inside, which is analogous to sliding an old fashioned glass thermos bottle lining up over the collection tubes. The hot water flows only through the manifold at the top of the array -- not in the glass tubes. The following graphs are updated automatically every hour for this web page as well as transmitted to NOAA.
Today's Weather


The solar panel setup looked like this before pipe insulation was installed:
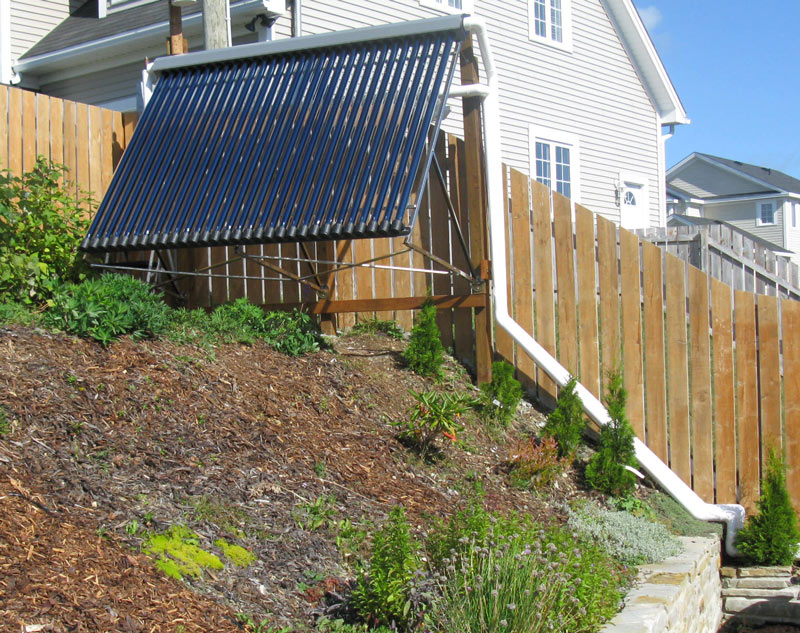
Here it is again after the 1" thick fiberglass pipe insulation (Manson datasheet) was installed and covered with #7 PVC sheathing. Out of curiosity we tried running it for awhile un insulated, but the 150 feet of 3/4" copper pipe radiated so much heat that the maximum storage tank temperature achievable in September was 80°F / 27°C. Don't even think about running these systems without thick insulation in cold climates.
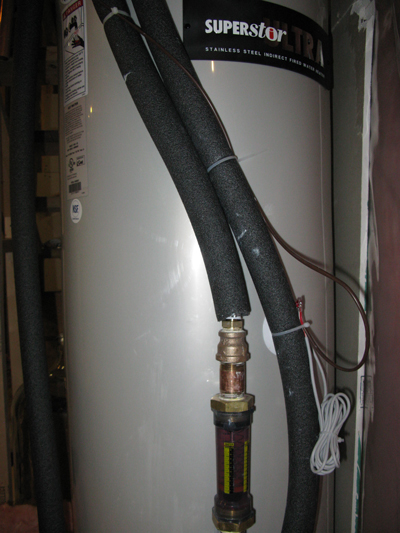
A 45 gallon stainless steel water storage tank is used as a heat sink for energy storage. There is a thermometer well (intended for an aquastat) in the lower third of the storage tank which contains the tank sensor for the pump system. The temperature sensor is pushed all the way into the tube and the outer inch of tube is stuffed with fiberglass insulation to keep it from coming out. The 45 gallon size is good for a 30 tube collector, allowing the temperature to approach 50°C in the summer.
Methodology
Comparing energy bills before and after is not an option because there are far too many variables beyond our control. Instead, we will be calculating the actual energy pumped into the house and calculating its financial value. We are also recording the solar radiation levels for later analysis with the intent of being able to predict the energy collected in the house from the outdoor weather (solar radiation and temperature) conditions.
For our first pass, we are allowing the solar storage tank to heat up as much as possible during the day while eliminating domestic hot water usage during the day. This allows us to calculate the energy stored based on the mass of the water and the temperature differential. To get the starting temperature, we scroll through the log file of the RESOL software and note the tank temperature at the time the solar pump turned on the first time for the day. Since the RESOL software only samples the data once a minute, the first pumping of the morning might not be captured if it is short because of the cold water in the piping system. In this case, if there is a dip in temperature before the first recorded pump cycle, we take the earlier stable tank temperature. The final temperature is the tank temperature after the last pump cycle of the day. Tank temperatures are accurate to 0.2°C .
There may be some temperature inaccuracies due to the water temperature stratification. Once we have accurately measured the flow rates, we will allow the RESOL controller to calculate the kWh transferred and see how it compares. Flow rates will vary with temperature as the viscosity changes, and this particular controller does not have the ability to monitor variable flow rates -- so our first method will likely be much more accurate.
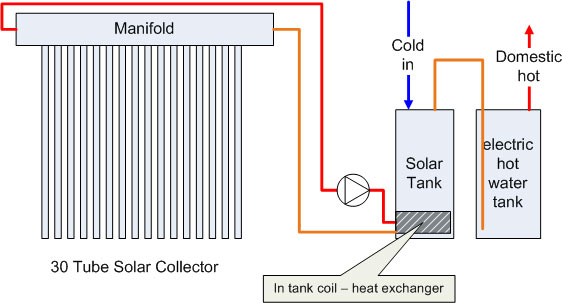
Block Diagram:
The 45 gallon storage tank with heat exchanger coil and Omega Engineering FL-500 flow meter attached is shown below:
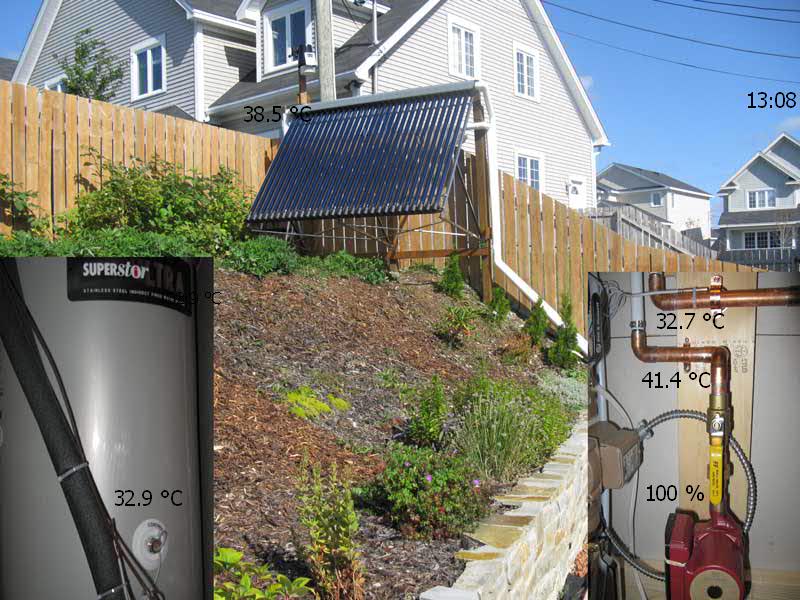
The RESOL controller has a software package that allows data acquisition, storing text results in a daily log file at 1 minute intervals. It also allows you to superimpose data values (pump speed, temperatures, etc.) on a photo like this:
The system consists of one Grundfos brand circulator pump, a RESOL brand differential controller and a small collection of standard hydronics parts (fill and drain valves, bubble separator, expansion tank and some isolation valves). You can buy this in the form of a "solar fill station" if you don't like building everything from scratch.
Standard Solar Maps
The Canadian government publishes solar radiation maps for the months of June and December as well as annual figures. These are good for approximations, but we need true local data - hence the weather station on top of the solar panel.
The Canadian solar radiation maps below can be enlarged by clicking on them. They are quite large and may take a while to load. The values are in MJ/m2/day for the months of June and December. That is Mega Joules (energy) per square meter, per day.
Canadian Solar Radiation December and June (credit: Natural Resources Canada)

Canadian Solar Radiation April and October (credit: Natural Resources Canada)

Canadian Annual Solar Radiation (credit: Natural Resources Canada)

For the install location, we have the following published figures (from 1984) and as new data is collected, we will publish our own averages. Note that the maps above are poorly presented and very confusing and with inconsistent legends and badly rendered colors. I wrote NRCAN about this and recevied the following reply:
"Yes, 26 colours in a legend are hard to differentiate on a computer screen. These 5th Edition maps were scanned to be archived and the Atlas does not plan to update them soon. The solar radiation data that were used to create these maps came from Environment Canada's Atmospheric Services. I suggest that you contact them for more precise information. See: http://climate.weatheroffice.gc.ca/Welcome_e.html "
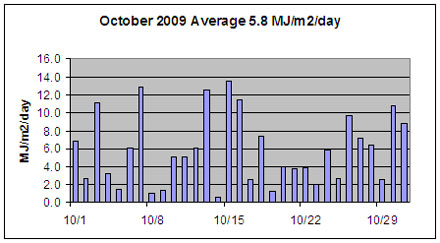
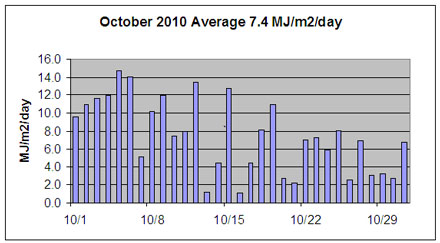
The following is actual monthly solar radiation as collected by the Davis Pro II weather station above the solar collector. In the table below it are smaller graphs showing the daily components of the monthly averages.
| Period | Government Figures MJ/m2/day Horizontal |
Measured at the ground MJ/m2/day | comments |
| Jan | 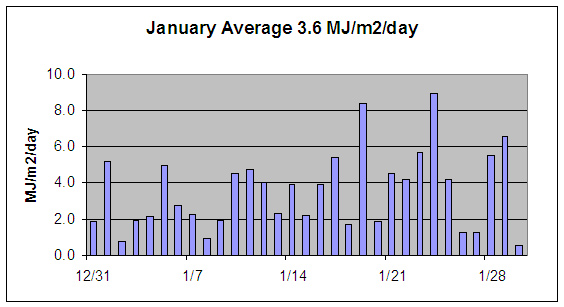 |
2010 | |
| Feb. | 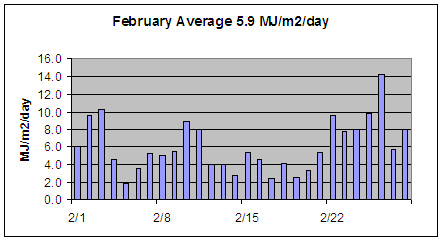 |
2010
|
|
| March | 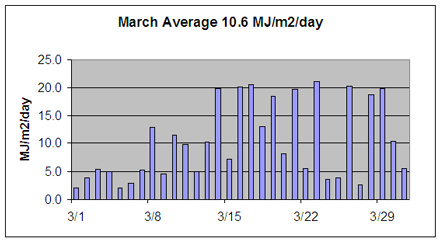 |
2010 | |
| April | 13 | 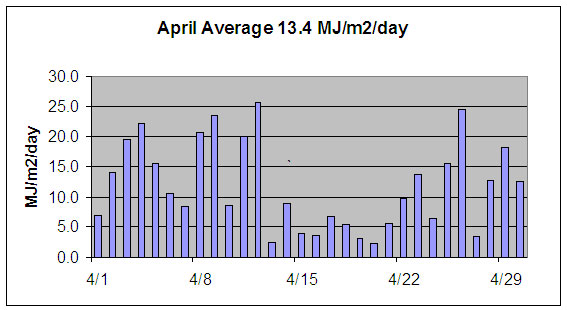 |
2010 |
| May | 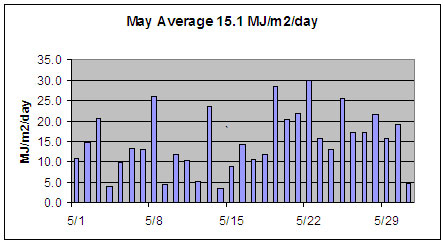 |
2010 | |
| June | 20 | 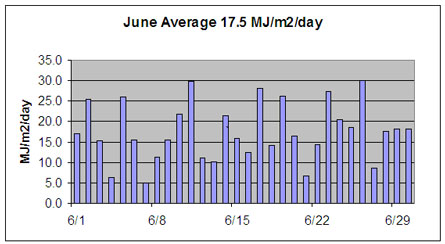 |
2010 |
| July | 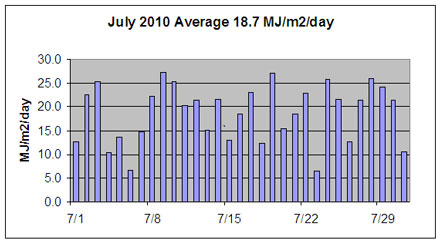 |
2010 | |
| August | 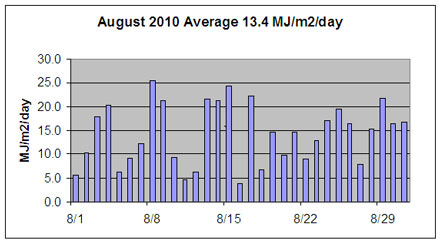 |
||
| September | 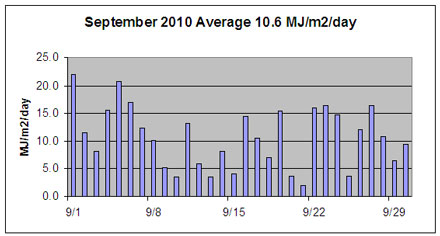 |
||
| October | 7 |
|
2009-2010 average is 6.6 |
| November | 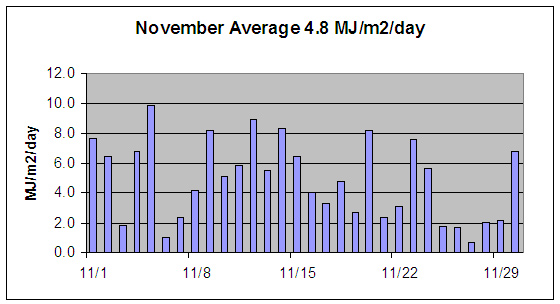 |
2009 | |
| December | 3 | 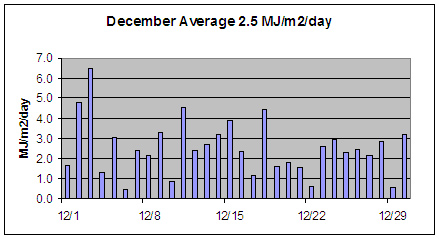 |
2009 |
| Annual | 11 | 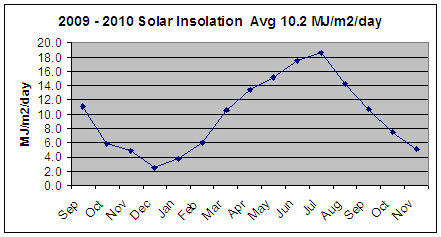 |
|
In the economic estimates later, we will use the annual value of 10 MJ/m2/day. For the period September 2009 to September 2010 the solar map figure of 11 MJ/m2/day would have overestimated the incoming solar radiation by approximately 10%. Next year might be different so we cannot say that the maps overestimate the annual readings.
Standard Collector Efficiencies
For a rough calculation, we can use the equations provided by evacuated tube manufacturers. However, we are more interested in practical system efficiencies such as the energy gained by a storage tank in the house which includes losses from the array, piping and pumping systems.
The graph below is generated using the parameters from Apricus brand tubes, assuming that water is being heated to 50°C in the manifold and illustrates some important concepts. As the outdoor temperatures drops (the horizontal axis is the temperature in degrees C), so does the efficiency of the collector. This is due to heat losses which are proportional to the temperature difference. The second is as the solar output falls (e.g. Winter), the tubes heat up less and transfer less heat, further reducing efficiency. Therefore, on a cold and freezing winter day, you could expect only about 40% of the available heat could be collected. Finally, the performance equations are only for the parts of the collector that actually absorb sunlight.
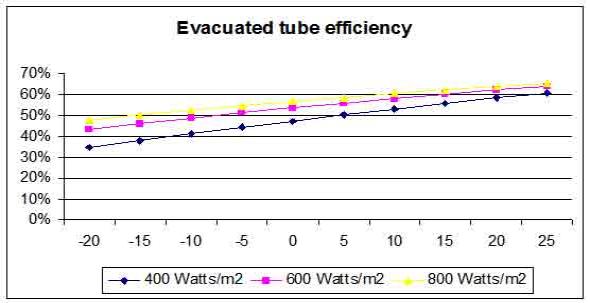
On a 15°C/60°F day, it would appear that the collector could approach 60% efficiency.
A more important issue is efficiency versus solar radiation levels. The efficiency drops to zero in a rain storm with dense cloud cover. The lines in the graph above hint at dropping efficiencies with lower light levels but fail to show the rapid drop off as insolation approaches a minimum threshold for the panel. This points again to the need for local data.
Local Insolation Data:
Local solar radiation data for most of the world is scarce. There are many areas where lower lying areas might get lots of fog when higher points a few miles away are always sunny yet the insolation maps above have bands that are hundreds of miles wide and thousands of miles long which is anything but local.
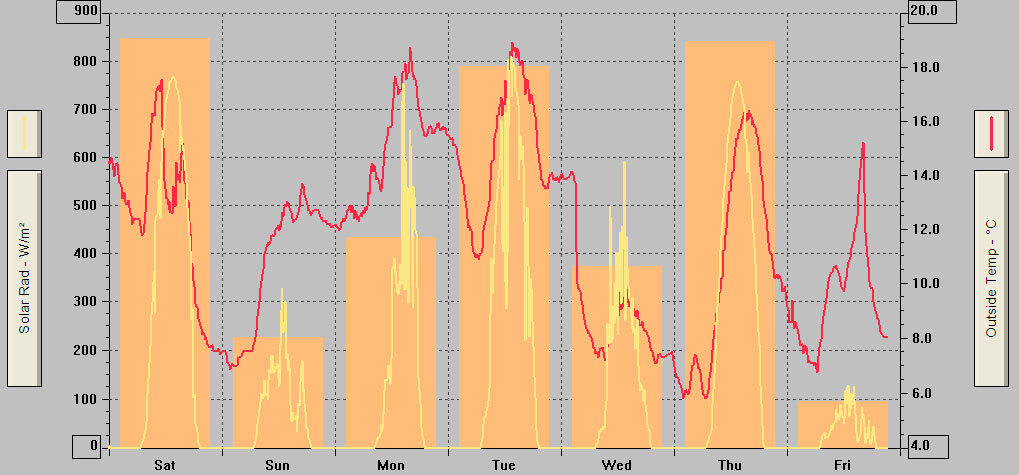
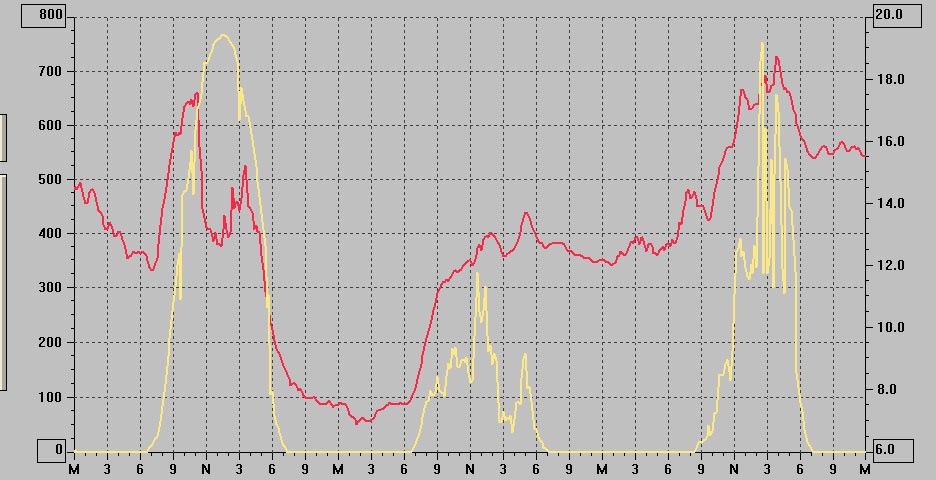
The chart below is a five day example recorded at the solar collector. The vertical bars are in Langly (flux). The yellow line is in W/m2 and the red is outdoor temperature in Celsius.
The radiation sensor resolution is 1W/m2. Accuracy is +/- 5% of full scale (0 to 1800W/m2) or 90W/m2 . For our noon figures, we are accurate to about 10% -- which is adequate for our purposes. For better accuracy we would probably have to use a thermopile as opposed to a PiN diode based sensor.
The Worst Case Scenario
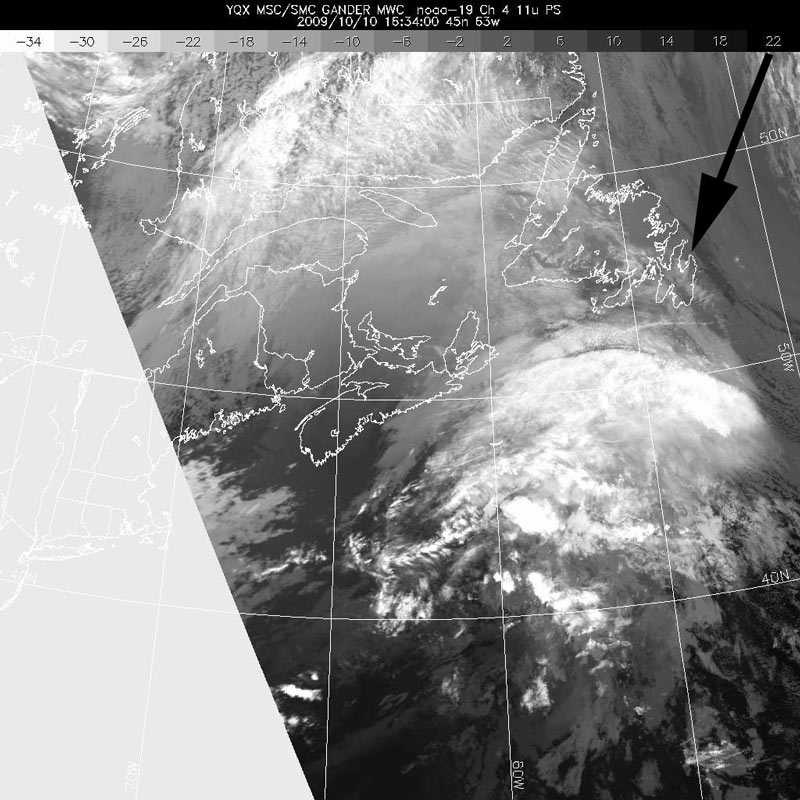
Consider October 8, 2009. The satellite photos look like this (40mm of rain in the last 24 hours, and you can see the hurricane like cloud formations):
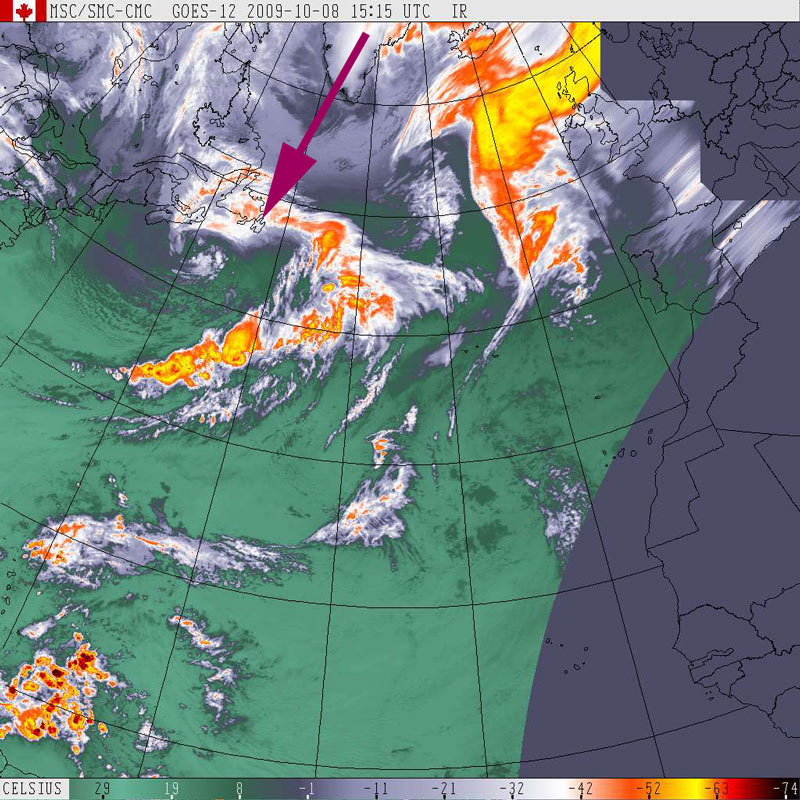
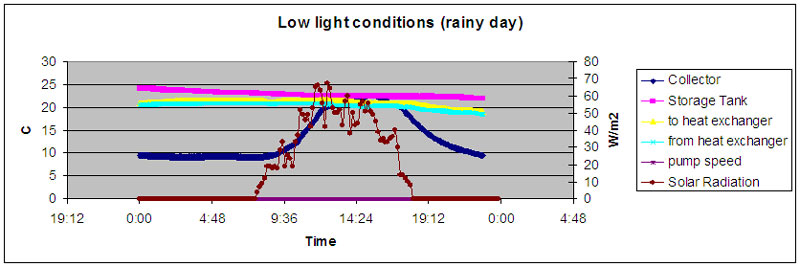
In the graph below, the pink line is the water in the solar storage tank. The blue line is the temperature in the collector manifold. Although the collector warmed slowly throughout the day, it never reached room temperature and was therefore useless. The peak collector temperature was 18.4C at 3:15pm, the same as the timestamp on the satellite photo. The yellow and cyan lines were at room temperature because the circulation pumps did not run at all.
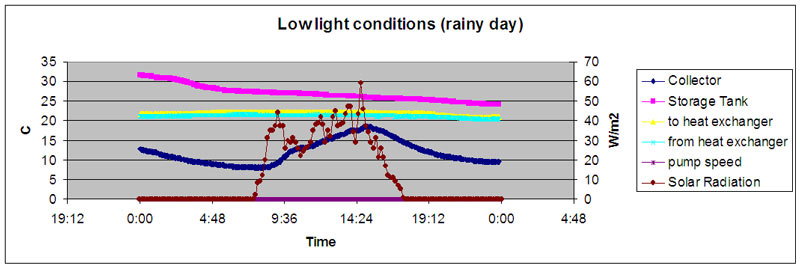
The total solar radiation for the day was 1044600J/m2 or 1MJ/m2. It is likely that our model will have to ignore days below a certain threshold to improve predictions. If you include the sunny and rainy days together into a monthly average, you end up assuming that the meager energy collected on a dull day is also harvested at the system efficiency, rather than zero.
Here is the graph and satellite image again the following day. Total solar radiation was 1399800J/m2 or 1.4MJ/m2. This is significant because it is just enough to bring the collector up to room temperature.
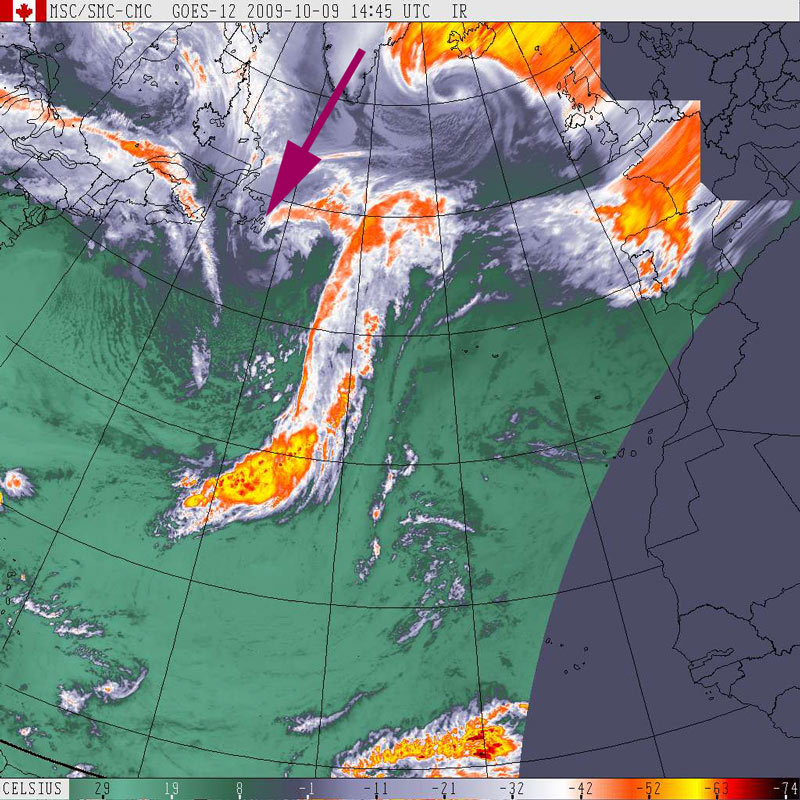
This is two days in a row with no usable radiation totals, but it does give us a lower limit of about 1.4MJ/day as the minimum required to bring the collector to room temperature. The pump only operates when there is a delta of several degrees, so the useful limit in MJ/m2/day will be a little higher -- and this will be encountered randomly soon enough.
Here is day three in this series, slightly brighter, and a small gain for a change. We used a different satellite this time. Another storm approaches -- this is typical when the jet stream decides to hang over the area and pull every low pressure area in North America our way for endless storm after storm after storm.
This system performance was 11% during this dull day. The dip in the yellow line was the cold water in the piping to and from the collector being flushed through the system. Incoming radiation for the day was 5163000J/m2 or 5MJ/m2.
At this point we are beginning to see a pattern in the graph below. Below about 3 MJ/m2/day we get nothing. At approximately 4 MJ/m2/day it then increases rapidly to above 40%. The extreme variability around 5 MJ/m2/day is likely due to whether the day is dull vs even duller but with a period of bright sunshine. As more data is collected, this will become more clear.
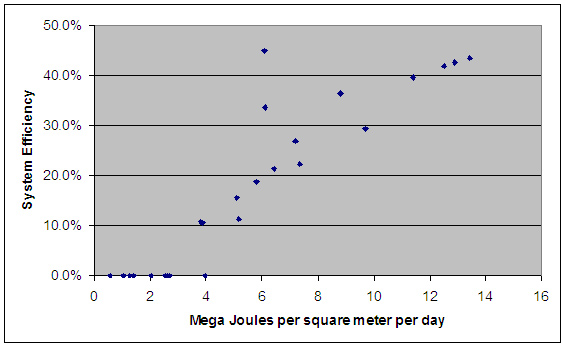
The satellite maps could potentially be used to predict ground level solar radiation levels but from what I have seen so far, it is likely prone to great errors because even very small changes at low levels can result in large changes in system efficiency.
Test results
To minimize the complexity of the analysis, the following simplifications were made:
- Hot water was not drawn during the testing period (e.g. domestic hot water was not used).
- The start and end storage tank temperatures were used, rather than calculating the energy captured incrementally with a flow meter and temperature deltas.
- Solar radiation was logged every 10 minutes. Temperatures are logged every minute.
The first task was to calculate an efficiency for the entire system and compare it to vendor published results. Vendor data is for the collector only. In the real world, it is the efficiency of the entire system that correlates to home comfort and monthly expense.
To calculate the energy inputs, the incoming solar radiation was accumulated. Sampling was performed every 10 minutes, so the daily incoming energy was the sum of 600 second intervals x 2.4m2 (collector area) x solar radiation in W/m2. The results in Joules are recorded in a table below. This will be changed to a mySQL real-time extract later as the collection is an ongoing, multi-year effort. The example graph below is for September 12-14, 2009.
Outside temperature is recorded because efficiency later will be shown to be proportional to the outside temperature, e.g. if it gets cold enough, say -30°C, the heat losses through the solar collector manifold and exterior piping to the house will equal the solar gain and the system will not be useful.
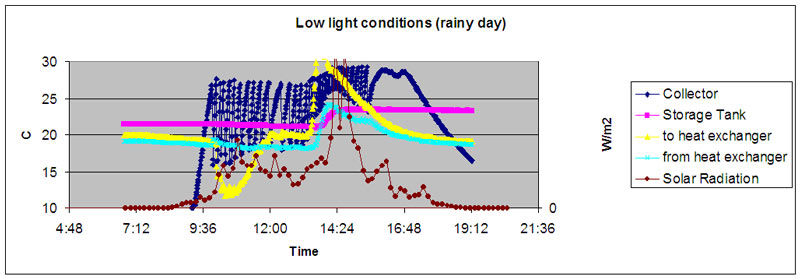
The RESOL unit has a computer interface, so it is possible to superimpose the weather data with the system temperatures like this:
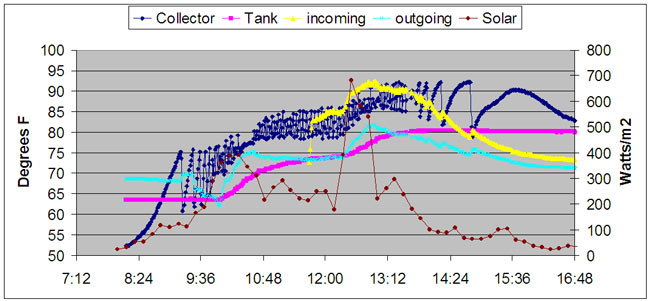
This is rather messy, but it shows that the collector manifold heats up slowly and quickly cools down quickly once the pump starts, giving the blue line a saw tooth appearance. We will try reducing the flow rate and see if it makes any difference to the efficiency of the system. When the light levels are about 250W/m2, the water entering the heat exchanger ended up exiting at tank temperature. When things got a little brighter at noon, the exit of the heat exchanger was warmer than the tank because the heat exchanger couldn't transfer heat fast enough. By 13:00 hours it became hopeless. The collector warms up very slowly and cools down almost instantly after the pump turns on probably because the water in the pipes (green /yellow) had cooled down significantly.
The final result for the rainy day shown above was 44% efficiency (Joules added to tank / Joules from Sun). With the Taco unit, a day like this would have been about 35% efficiency.
Energy Inputs:
W/m2 recorded by the weather station * 2.4 m2 (collector surface area, not the panel surface area)
Pumping energy -- The Taco unit (worst case because the new system only has a single 55W circulator pump) consumes about 0.73kWh on a sunny day when measured with a kWh meter over the run of the sunlit period. Solar storage on such a day (based on Sept 17, 2009) was 23,394,667J or 6.5kWh. Therefore, pumping overhead is .73/6.5 or about 11%. We chose not to insulate the pumps because they run very hot and we didn't want to overheat them. Since the heat is useful when installed in conditioned space of a house (e.g. a heated basement), it is not really a waste but does complicate being self sufficient. We will calculate the size of a solar grid array soon required to power the pumping system. The total annual cost would appear to be about .72 kWh * 365 * $0.12/kWh or $31 at current electric rates. Adding a second panels would not have added additional pumping costs.
Output (stored energy in tank):
170l x 1000g/l x 4.16 J/gC x temperature gain (C)
The system efficiency is therefore Input/Output and is summarized as follows:
We are ignoring from this analysis the energy input of the pumping system. It appears that most of the heat losses from the pumps are lost to the air, and not transferred through the pump housing into the water. To harness this in cool climates you would want to ensure the tank and pumping equipment is in the heated area of the home so that it contributes to space heating.
The preliminary results are making it clear that efficiency rapidly drops off at lower sunlight levels, due in part to the temperature of the storage tank (too high for the energy inputs) and heat losses in the piping system and manifold assembly. The published annual average of 11MJ per square meter per day looks like it will result in a system efficiency somewhere around 40%.
Manufacturers like to quote panel efficiencies which are considerably higher than this. Consider a panel that collects difuse light on a cold and cloudy winter day and raises the water/glycol mix from -10°C to +10°C. It may be quite efficient and capture 50% of the available energy but from a system point of view (collector + plumbing + pumping + storage + house), the efficiency is zero because the 10°C water is useless. In otherwards, we collect solar radiation but get no usable energy that can help with domestic hot water or space heating needs. If we wanted 10°C water, we could just have pumped it from a well.
At 40% efficiency and the average daily mean of 11 MJ/m2 (from government maps for now), we get an annual energy output of: 40% * 11MJ/m2 * 2.4m2 * 365 days/year = 3854MJ (1070 kWh) which is worth about $128. Pumping costs are about $31. The $31 is not a waste during the heating season however, we will assume a worst case where the pumps are in unheated spaces.
The electricity costs in Newfoundland are $.09631/kWh but once the $15.56 basic charge and taxes are added and the early payment discount subtracted, it ends up being around 12 cents per kWh. The basic charge unfortunately penalizes people that use very little power. A single kWh would cost a hefty $17.58. I don't have data for the rest of the Maritimes -- please feel free to contribute real costs (your bill total with all fees and taxes divided by kWh used) and I will insert a chart here.
The present value of $97 (solar contribution of $128 minus pumping costs of $31) a year for 30 years with a nominal interest rate of 7% is about $1200. If you don't discount the value of money over time, the present value is $2900. Historically, 7% has been the average growth of the stock market over the last 200 years -- but deflation might make zero % more appropriate since you can't invest in much these days that will return a guaranteed profit nor guarantee that your money won't become worthless with hyper inflation.
The system above would cost about $5000 installed. Despite the apparent negative return on the investment, there is one major wild card -- energy prices. It is absolutely certain that fuel and electric rates will increase significantly during the 30+ year life of the system making the solar option look much more attractive financially. This leaves you with a few choices:
- wait until energy prices go up and worry about it later
- Take advantage of grant incentives AND install it yourself. $2500 off $4000 in parts for domestic hot water system does eventually break even, but the financial return is almost zero. The grants come nowhere close to making solar space heating affordable because they have caps -- and for space heating you would need several panels. Some of you might object at the idea of self-install, and the industry associations are pushing hard to control the market by insisting that anything that receives grant money must be installed by their members -- and that the company employing the installer must also be a member. A better approach is to allow anyone to do it themselves if they have the nerve and skill and then let the city inspect it for code violations (back flow prevention, type of heat exchanger, lead solder on potable water circuits, incorrect or missing pressure relief valves, etc).
- Install solar now just because you like the idea of self sufficiency and like being a leader. Your gamble might pay off financially and if not, it is your contribution to doing the right thing. (too bad being good doesn't pay).
Conclusion (ongoing)
Note: This analysis is constantly being updated. Until we have a year of data, we will have to guess at the monthly system efficiencies (which will be dependent on snow cover, storms, gales, etc.) and solar radiation. At this point, we believe the analysis is in the ballpark so to speak and indicates that with current government incentives and installing it yourself to eliminate all labor costs -- the systems do pay for themselves. Paying for installation and/or receiving no rebates or grants -- the systems might give you your money back but only if the energy prices go up substantially.
There are also clear areas to improve the economics. Installing a 2nd 30 tube panel for a total of 60 tubes would increase collection area by 100% while not requiring any additional pumping system components. Installing the pumping equipment in heated spaces would also improve matters since the energy used for pumping and heat losses from the interior pipe and fittings would be useful for space heating most of the year (October to June). February 2010 turned out to be very warm with most daytime highs around the freezing mark -- so less expensive flat plate collectors (as opposed to evacuated tubes) would have worked well.
We will also look at geothermal heat pumps as a more appropriate yardstick. With geothermal, each watt of power consumed generates about 3 watts of heat. Now that system prices are falling rapidly, a geothermal pump in the basement and a well drilled outside can be installed for the same price as a good solar system. The downside of course, is that unlike a solar thermal system which doesn't need much electrical power to run, geothermal guarantees you will likely be grid connected forever and at the mercy of future power rates.
Perhaps this is something that alternate energy enthusiasts don't want to year -- but the best place to put your money is into insulation. If you don't lose the heat in the first place, you don't have to produce it. As for domestic hot water, drain water heat recovery and low flow shower heads are the way to go. Domestic hot water heating with DWHR, low flow shower heads and cold laundry cycles will reduce your hot water energy demands to around 5 kWh a day. In the house being tested in this study, space heating dwarfs domestic hotwater energy demand by a factor of 10 to 1.
A final thought -- the test house with an R-37 insulated basement and R-90 insulated attic (which exceeds by far any building code in North America) requires 3000W continuous (24*7) to maintain 20C inside when it is at the freezing point outside. This is a sorry state of affairs for long term sustainability. It is clear that the modern house with windows galore is ridiculous. (obvious solutions include: eliminate North facing windows, use exterior insulated window shutters at night, daylighting systems that use fiber optics so that cold glass doesn't contact interior heated air, orient houses to the South, etc.).